When creating a chart or a map, you can change the font used, as well as set the size and color of the text to your liking.
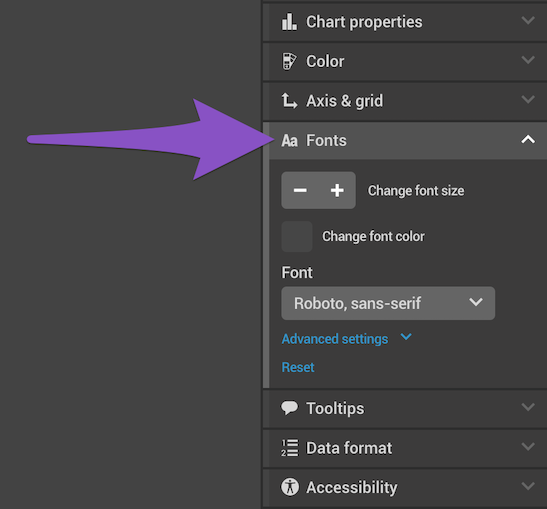
- To access font editing options for your chart or map, click on the chart/map to select it, then expand the Fonts tab in the settings panel on the right.

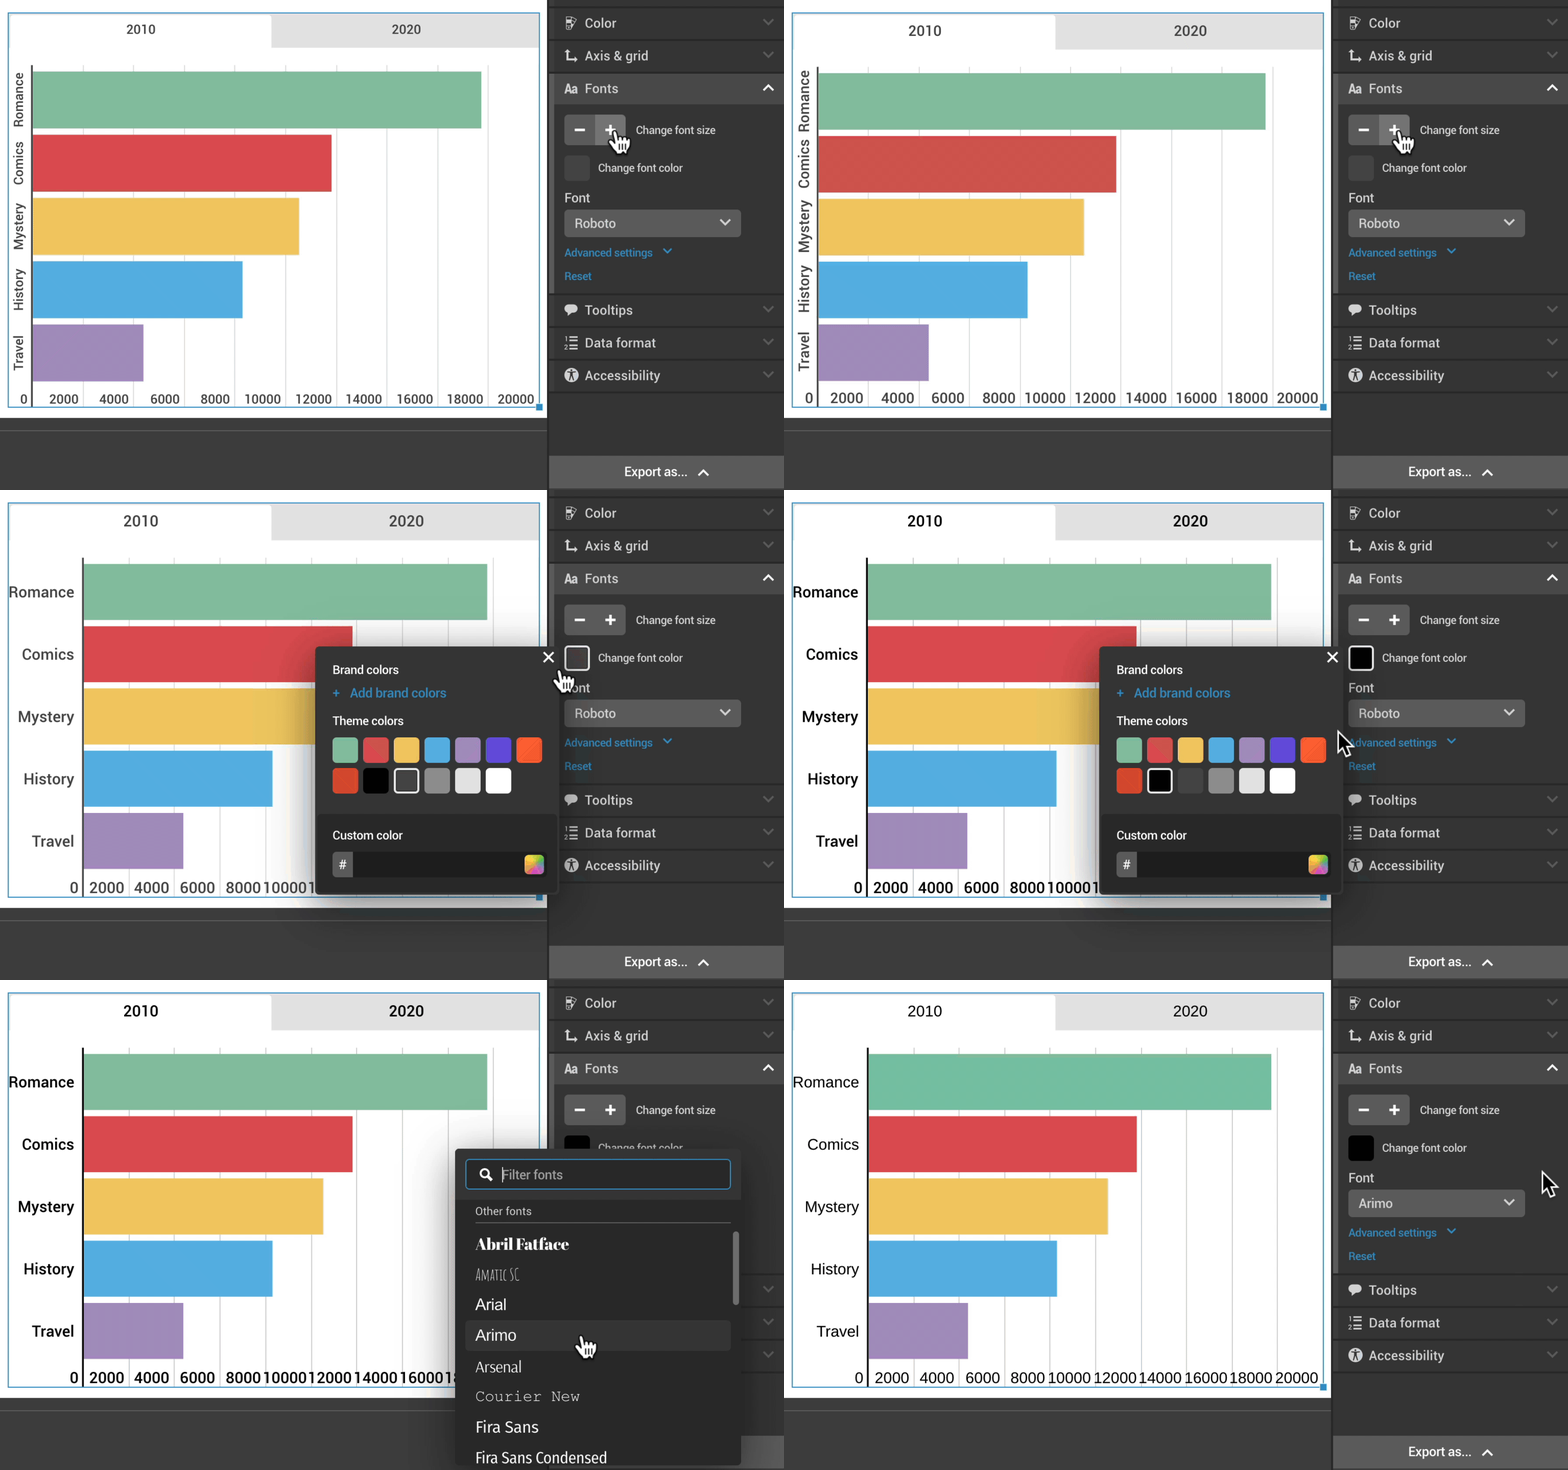
- Change the size of the font by clicking on - or + next to Change font size to make it smaller or bigger, respectively.
- To change the color of the font, click on the color box next to Change font color. Select one of the theme colors, use the color picker, or enter a hex code.
- To change the font of your chart/map, click on the Font dropdown and choose the font you'd like to use.

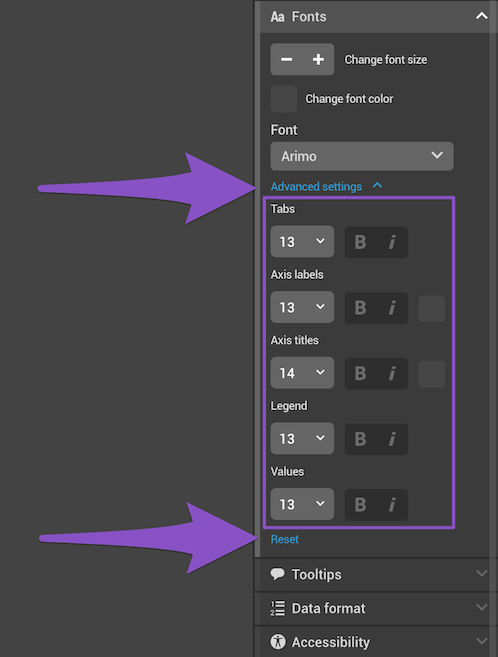
- Click on Advanced settings to edit the fonts of individual elements of your chart or map. Here, you can also make the text bold or italic.
- To go back to the original formatting, click on Reset.
