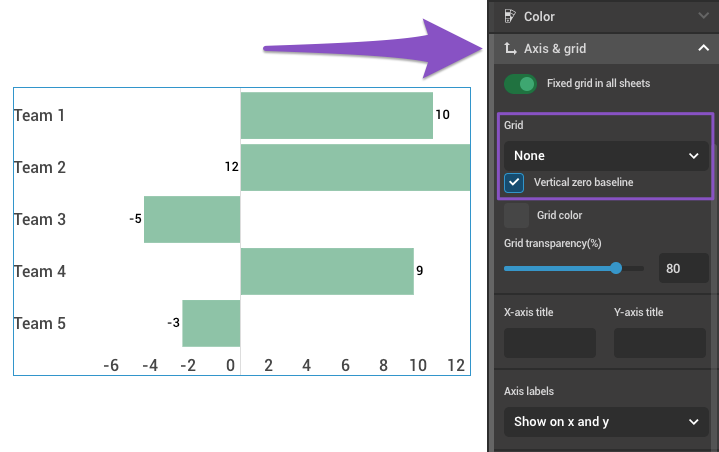
Use the zero baseline setting when showcasing positive and negative values in a chart. This option is available in line, bar, column, area, multiple axes, scatter, bubble, and financial charts. Depending on the chart type you are using, you can have a horizontal zero baseline or a vertical zero baseline.
- Select the chart by clicking on it.
- Expand the Axis & grid tab in the right-side settings panel.
- For the zero baseline option to appear, choose None in the Grid dropdown.
- Enable the horizontal zero baseline or vertical zero baseline setting .
