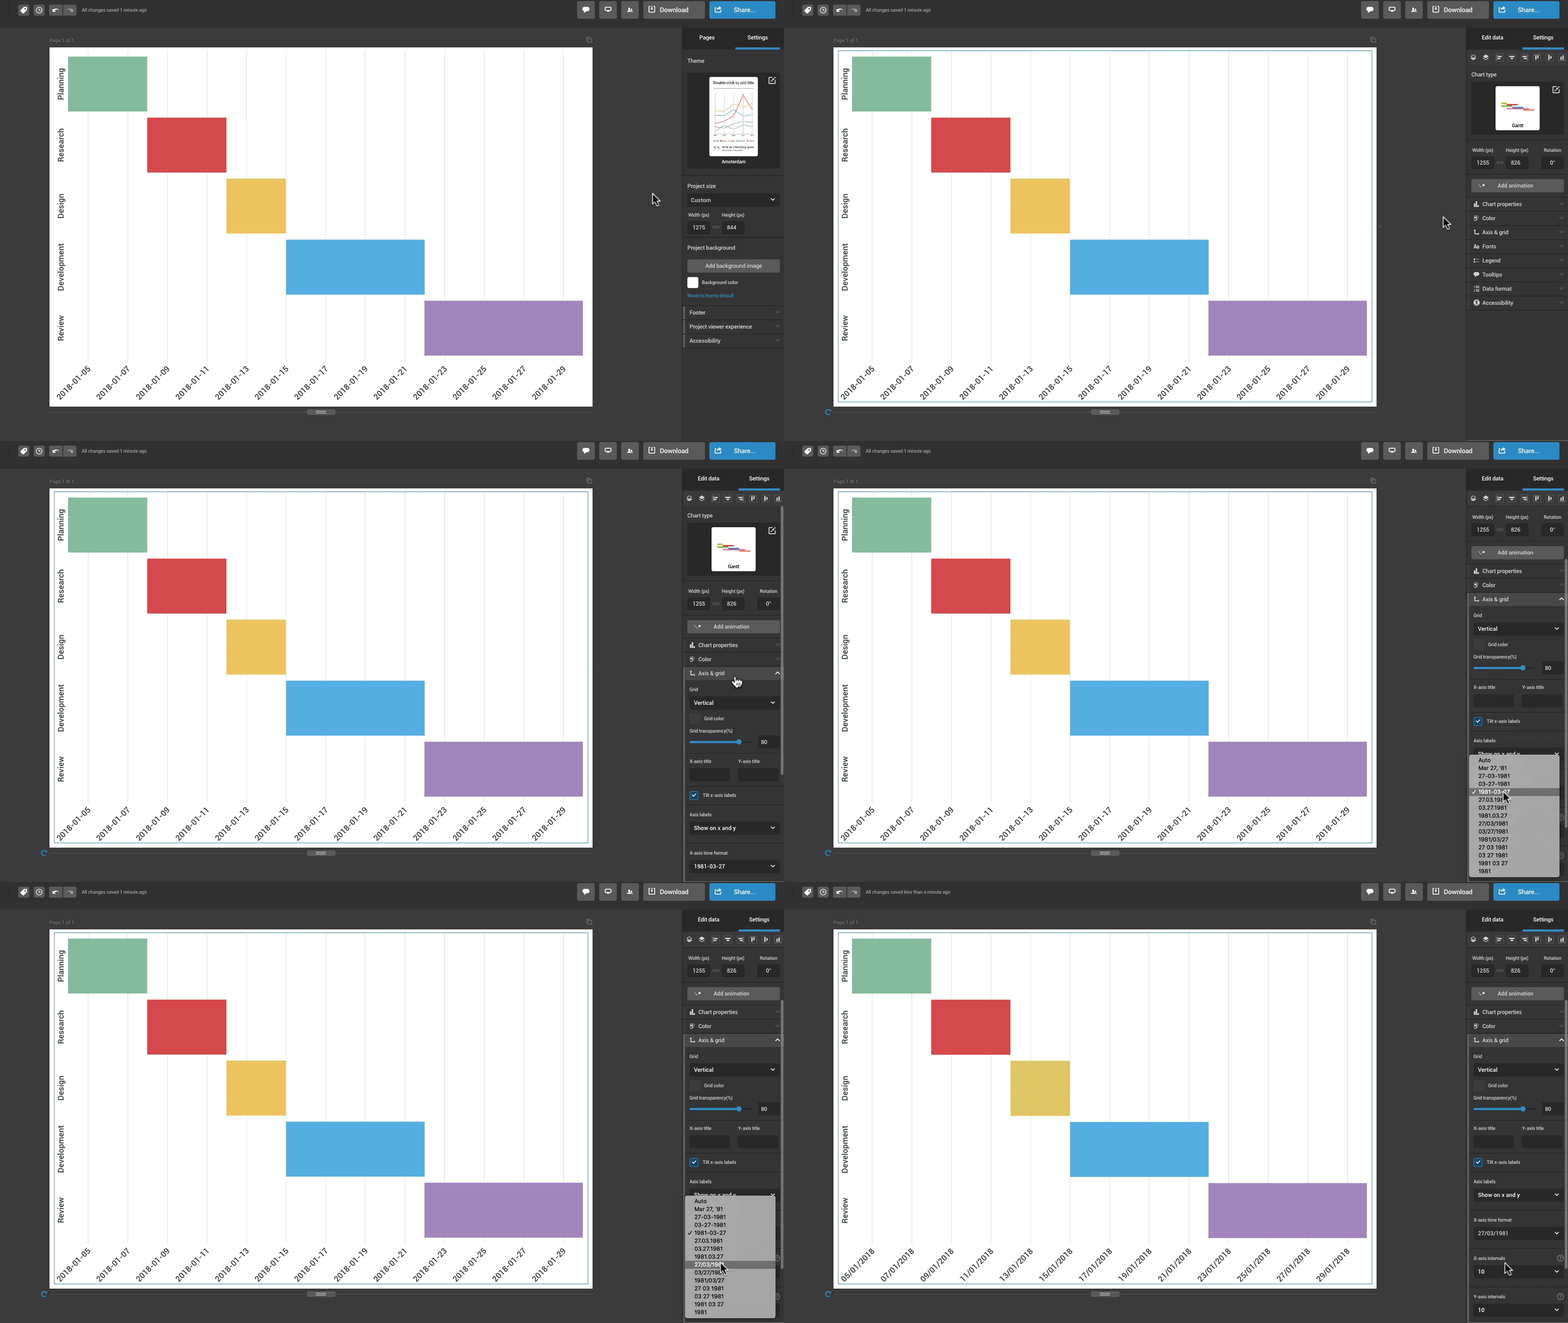
Gantt and Candlestick charts contain a date-based X-axis that allows you to choose the format that suits you best: year-month-day, day-month-year, and more.
- Click on the chart to select it.
- Expand the Axis & Grid tab in the settings panel on the right.
- Under X-axis time format choose any of the available options.
