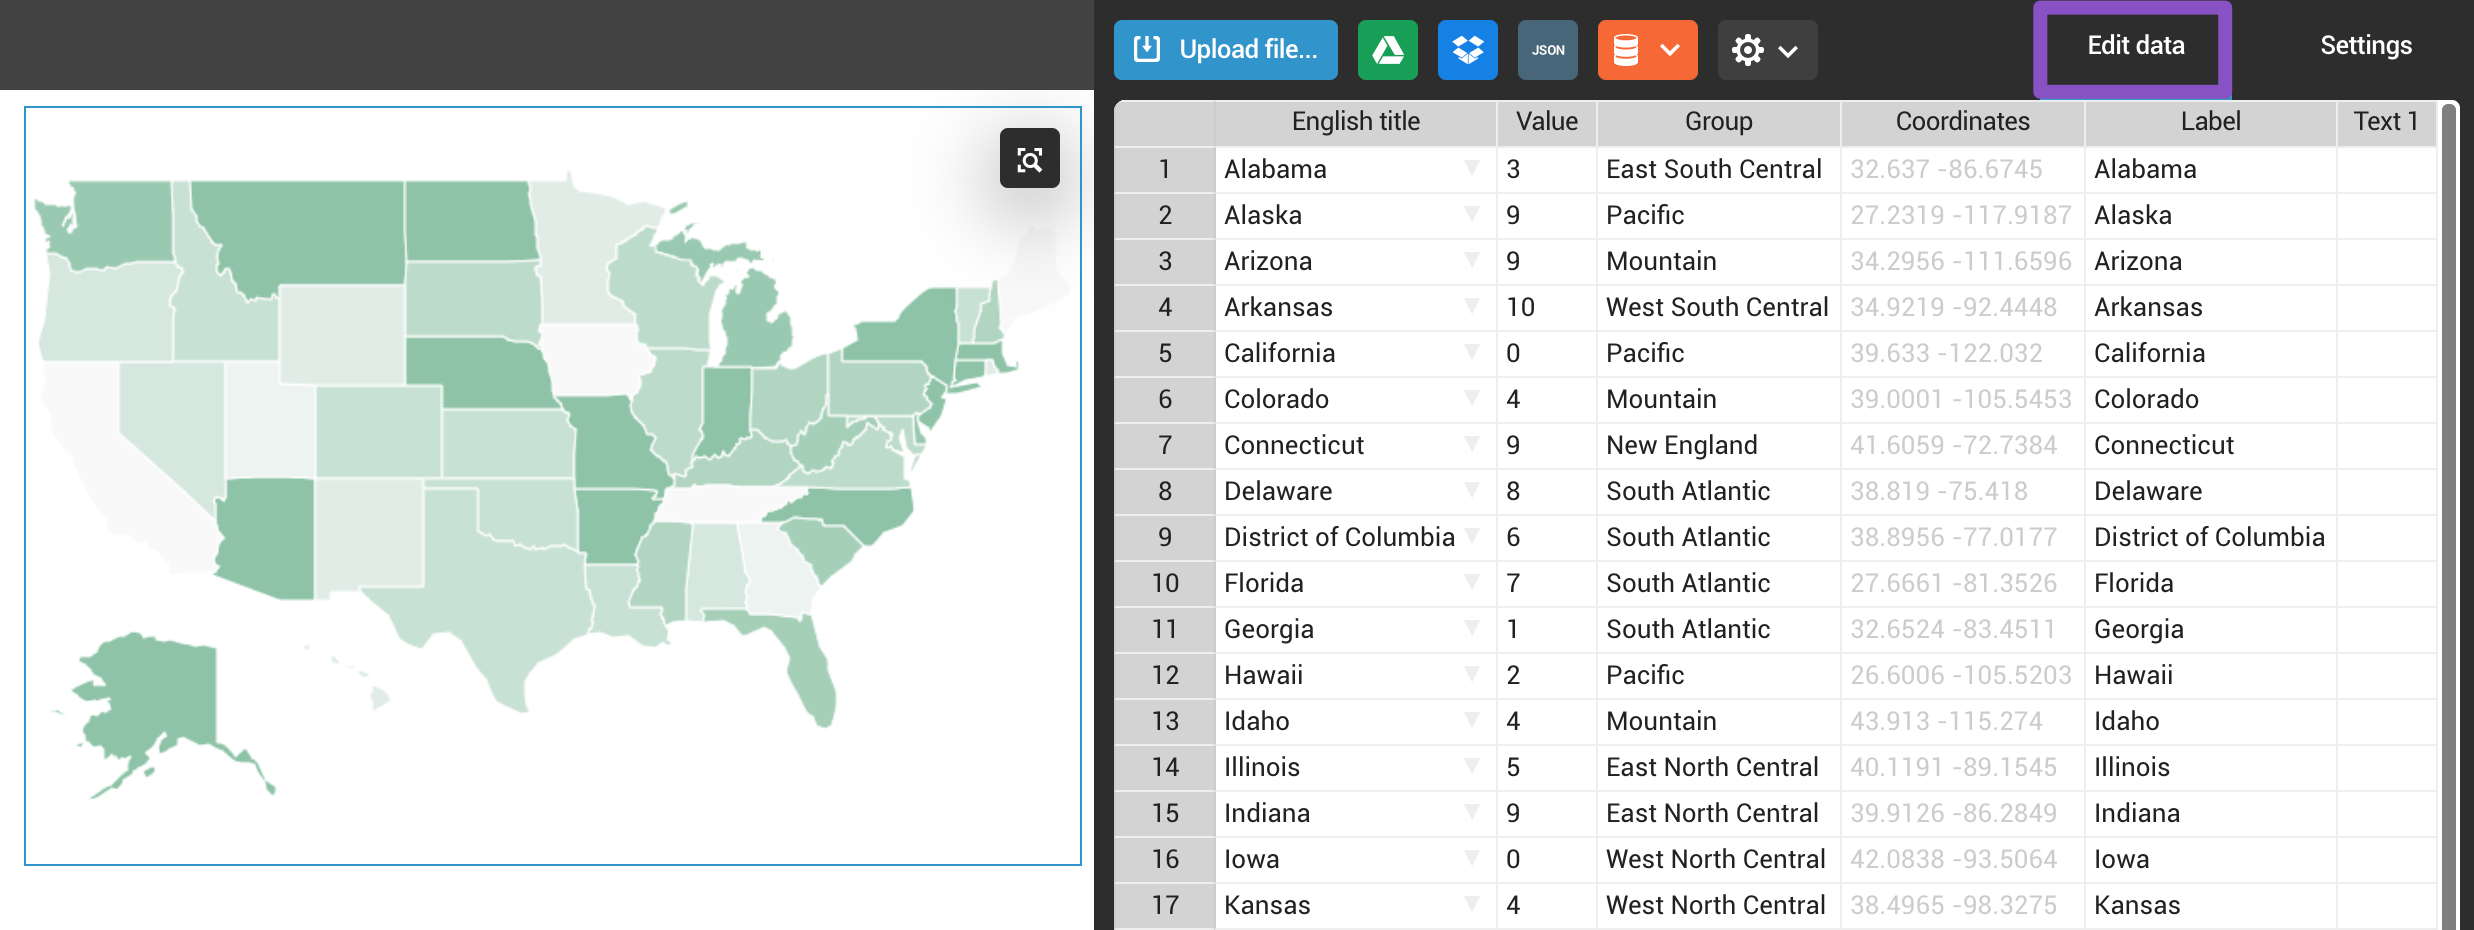
After you've inserted a map into your project, it's time to add the data you want to visualize. Simply double-click on the map or head over to the Edit data tab in the settings panel on the right to introduce changes in the datasheet.
When importing data, be sure to keep the following formatting and layout of the default dataset for the map to display correctly.
- Column 1 (English title): Country or region for the Area map. City, address, landmark, etc. for the Icon map.
- Column 2 (Value): Numerical data.
- Column 3 (Group): Group entries (this column will be used if you've chosen the Grouped style for your map).
- Column 4 (Coordinates): Automatically populated when Column 1 is filled in. You can also copy-paste your own coordinates.
- Column 5 (Label): Whatever you insert in this column will be displayed in the map tags when hovering over data points.
- Column 6... (Text): Add additional text to appear in the tooltip when hovering over data points.
Note: In Column 4, you can also adjust coordinates manually (this is useful for placing markers when using the Icon map).