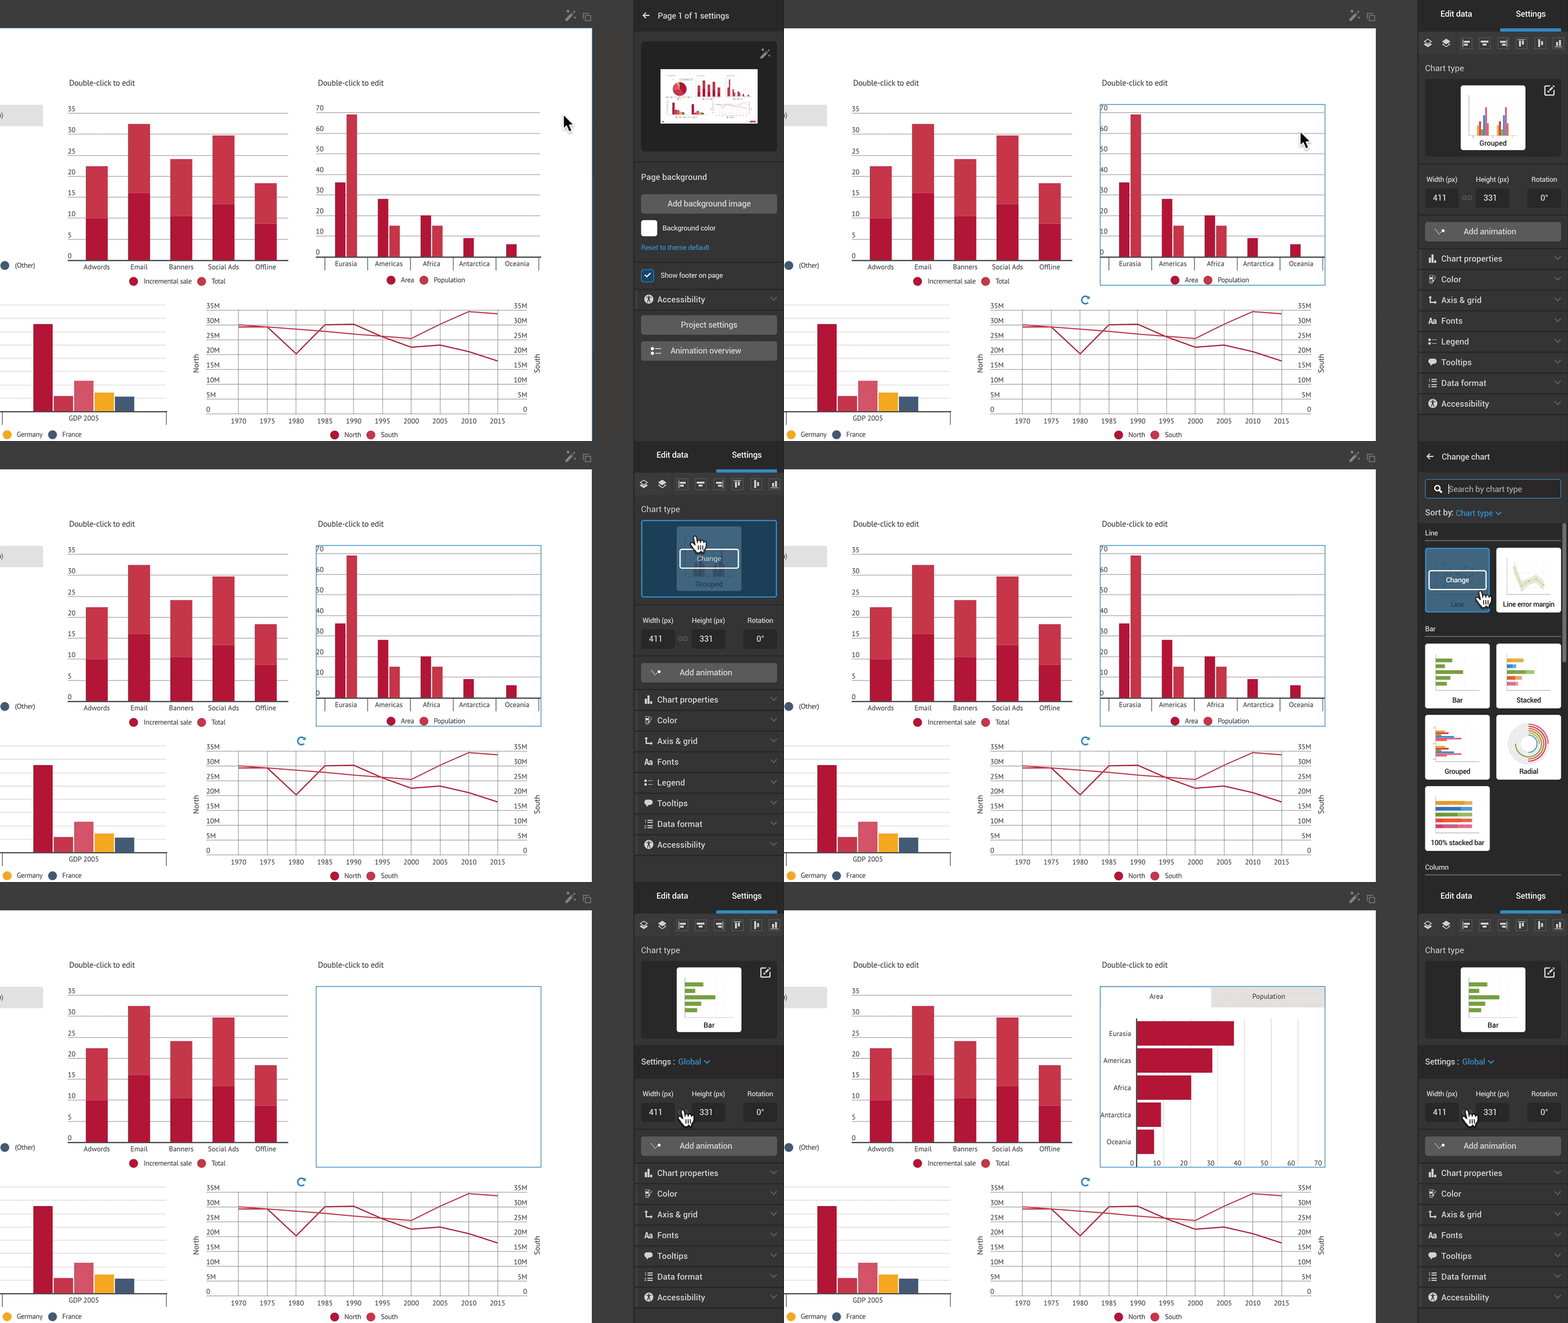
If you've already started entering indicators into a chart, but are considering changing it to a different visualization to better fit your data, you don't need to do start over. Simply switch to a different chart.
- Click on a chart to select it.
- Click on the chart thumbnail on the top of the settings panel on the right.
- Choose a different chart from the menu.
 Note: Some charts do not offer the option to switch to a different type, because of different data formatting. In this case, create a new chart from scratch.